This is the multi-page printable view of this section.
Click here to print.
Return to the regular view of this page.
Cluster Administration
Lower-level detail relevant to creating or administering a Kubernetes cluster.
The cluster administration overview is for anyone creating or administering a Kubernetes cluster.
It assumes some familiarity with core Kubernetes concepts.
Planning a cluster
See the guides in Setup for examples of how to plan, set up, and configure
Kubernetes clusters. The solutions listed in this article are called distros.
Note: Not all distros are actively maintained. Choose distros which have been tested with a recent
version of Kubernetes.
Before choosing a guide, here are some considerations:
- Do you want to try out Kubernetes on your computer, or do you want to build a high-availability,
multi-node cluster? Choose distros best suited for your needs.
- Will you be using a hosted Kubernetes cluster, such as
Google Kubernetes Engine, or hosting your own cluster?
- Will your cluster be on-premises, or in the cloud (IaaS)? Kubernetes does not directly
support hybrid clusters. Instead, you can set up multiple clusters.
- If you are configuring Kubernetes on-premises, consider which
networking model fits best.
- Will you be running Kubernetes on "bare metal" hardware or on virtual machines (VMs)?
- Do you want to run a cluster, or do you expect to do active development of Kubernetes project code?
If the latter, choose an actively-developed distro. Some distros only use binary releases, but
offer a greater variety of choices.
- Familiarize yourself with the components needed to run a cluster.
Managing a cluster
Securing a cluster
Securing the kubelet
Optional Cluster Services
1 - Certificates
To learn how to generate certificates for your cluster, see Certificates.
2 - Managing Resources
You've deployed your application and exposed it via a service. Now what? Kubernetes provides a
number of tools to help you manage your application deployment, including scaling and updating.
Among the features that we will discuss in more depth are
configuration files and
labels.
Organizing resource configurations
Many applications require multiple resources to be created, such as a Deployment and a Service.
Management of multiple resources can be simplified by grouping them together in the same file
(separated by --- in YAML). For example:
apiVersion: v1
kind: Service
metadata:
  name: my-nginx-svc
  labels:
    app: nginx
spec:
  type: LoadBalancer
  ports:
  - port: 80
  selector:
    app: nginx
---
apiVersion: apps/v1
kind: Deployment
metadata:
  name: my-nginx
  labels:
    app: nginx
spec:
  replicas: 3
  selector:
    matchLabels:
      app: nginx
  template:
    metadata:
      labels:
        app: nginx
    spec:
      containers:
      - name: nginx
        image: nginx:1.14.2
        ports:
        - containerPort: 80
Multiple resources can be created the same way as a single resource:
kubectl apply -f https://k8s.io/examples/application/nginx-app.yaml
service/my-nginx-svc created
deployment.apps/my-nginx created
The resources will be created in the order they appear in the file. Therefore, it's best to
specify the service first, since that will ensure the scheduler can spread the pods associated
with the service as they are created by the controller(s), such as Deployment.
kubectl apply also accepts multiple -f arguments:
kubectl apply -f https://k8s.io/examples/application/nginx/nginx-svc.yaml \
  -f https://k8s.io/examples/application/nginx/nginx-deployment.yaml
It is a recommended practice to put resources related to the same microservice or application tier
into the same file, and to group all of the files associated with your application in the same
directory. If the tiers of your application bind to each other using DNS, you can deploy all of
the components of your stack together.
A URL can also be specified as a configuration source, which is handy for deploying directly from
configuration files checked into GitHub:
kubectl apply -f https://k8s.io/examples/application/nginx/nginx-deployment.yaml
deployment.apps/my-nginx created
Bulk operations in kubectl
Resource creation isn't the only operation that kubectl can perform in bulk. It can also extract
resource names from configuration files in order to perform other operations, in particular to
delete the same resources you created:
kubectl delete -f https://k8s.io/examples/application/nginx-app.yaml
deployment.apps "my-nginx" deleted
service "my-nginx-svc" deleted
In the case of two resources, you can specify both resources on the command line using the
resource/name syntax:
kubectl delete deployments/my-nginx services/my-nginx-svc
For larger numbers of resources, you'll find it easier to specify the selector (label query)
specified using -l or --selector, to filter resources by their labels:
kubectl delete deployment,services -l app=nginx
deployment.apps "my-nginx" deleted
service "my-nginx-svc" deleted
Because kubectl outputs resource names in the same syntax it accepts, you can chain operations
using $() or xargs:
kubectl get $(kubectl create -f docs/concepts/cluster-administration/nginx/ -o name | grep service)
kubectl create -f docs/concepts/cluster-administration/nginx/ -o name | grep service | xargs -i kubectl get {}
NAME           TYPE           CLUSTER-IP   EXTERNAL-IP   PORT(S)      AGE
my-nginx-svc   LoadBalancer   10.0.0.208   <pending>     80/TCP       0s
With the above commands, we first create resources under examples/application/nginx/ and print
the resources created with -o name output format (print each resource as resource/name).
Then we grep only the "service", and then print it with kubectl get.
If you happen to organize your resources across several subdirectories within a particular
directory, you can recursively perform the operations on the subdirectories also, by specifying
--recursive or -R alongside the --filename,-f flag.
For instance, assume there is a directory project/k8s/development that holds all of the
manifests needed for the development environment,
organized by resource type:
project/k8s/development
├── configmap
│   └── my-configmap.yaml
├── deployment
│   └── my-deployment.yaml
└── pvc
    └── my-pvc.yaml
By default, performing a bulk operation on project/k8s/development will stop at the first level
of the directory, not processing any subdirectories. If we had tried to create the resources in
this directory using the following command, we would have encountered an error:
kubectl apply -f project/k8s/development
error: you must provide one or more resources by argument or filename (.json|.yaml|.yml|stdin)
Instead, specify the --recursive or -R flag with the --filename,-f flag as such:
kubectl apply -f project/k8s/development --recursive
configmap/my-config created
deployment.apps/my-deployment created
persistentvolumeclaim/my-pvc created
The --recursive flag works with any operation that accepts the --filename,-f flag such as:
kubectl {create,get,delete,describe,rollout} etc.
The --recursive flag also works when multiple -f arguments are provided:
kubectl apply -f project/k8s/namespaces -f project/k8s/development --recursive
namespace/development created
namespace/staging created
configmap/my-config created
deployment.apps/my-deployment created
persistentvolumeclaim/my-pvc created
If you're interested in learning more about kubectl, go ahead and read
Command line tool (kubectl).
Using labels effectively
The examples we've used so far apply at most a single label to any resource. There are many
scenarios where multiple labels should be used to distinguish sets from one another.
For instance, different applications would use different values for the app label, but a
multi-tier application, such as the guestbook example,
would additionally need to distinguish each tier. The frontend could carry the following labels:
labels:
   app: guestbook
   tier: frontend
while the Redis master and slave would have different tier labels, and perhaps even an
additional role label:
labels:
   app: guestbook
   tier: backend
   role: master
and
labels:
   app: guestbook
   tier: backend
   role: slave
The labels allow us to slice and dice our resources along any dimension specified by a label:
kubectl apply -f examples/guestbook/all-in-one/guestbook-all-in-one.yaml
kubectl get pods -Lapp -Ltier -Lrole
NAME                           READY     STATUS    RESTARTS   AGE       APP         TIER       ROLE
guestbook-fe-4nlpb             1/1       Running   0          1m        guestbook   frontend   <none>
guestbook-fe-ght6d             1/1       Running   0          1m        guestbook   frontend   <none>
guestbook-fe-jpy62             1/1       Running   0          1m        guestbook   frontend   <none>
guestbook-redis-master-5pg3b   1/1       Running   0          1m        guestbook   backend    master
guestbook-redis-slave-2q2yf    1/1       Running   0          1m        guestbook   backend    slave
guestbook-redis-slave-qgazl    1/1       Running   0          1m        guestbook   backend    slave
my-nginx-divi2                 1/1       Running   0          29m       nginx       <none>     <none>
my-nginx-o0ef1                 1/1       Running   0          29m       nginx       <none>     <none>
kubectl get pods -lapp=guestbook,role=slave
NAME                          READY     STATUS    RESTARTS   AGE
guestbook-redis-slave-2q2yf   1/1       Running   0          3m
guestbook-redis-slave-qgazl   1/1       Running   0          3m
Canary deployments
Another scenario where multiple labels are needed is to distinguish deployments of different
releases or configurations of the same component. It is common practice to deploy a canary of a
new application release (specified via image tag in the pod template) side by side with the
previous release so that the new release can receive live production traffic before fully rolling
it out.
For instance, you can use a track label to differentiate different releases.
The primary, stable release would have a track label with value as stable:
name: frontend
replicas: 3
...
labels:
   app: guestbook
   tier: frontend
   track: stable
...
image: gb-frontend:v3
and then you can create a new release of the guestbook frontend that carries the track label
with different value (i.e. canary), so that two sets of pods would not overlap:
name: frontend-canary
replicas: 1
...
labels:
   app: guestbook
   tier: frontend
   track: canary
...
image: gb-frontend:v4
The frontend service would span both sets of replicas by selecting the common subset of their
labels (i.e. omitting the track label), so that the traffic will be redirected to both
applications:
selector:
   app: guestbook
   tier: frontend
You can tweak the number of replicas of the stable and canary releases to determine the ratio of
each release that will receive live production traffic (in this case, 3:1).
Once you're confident, you can update the stable track to the new application release and remove
the canary one.
For a more concrete example, check the
tutorial of deploying Ghost.
Updating labels
Sometimes existing pods and other resources need to be relabeled before creating new resources.
This can be done with kubectl label.
For example, if you want to label all your nginx pods as frontend tier, run:
kubectl label pods -l app=nginx tier=fe
pod/my-nginx-2035384211-j5fhi labeled
pod/my-nginx-2035384211-u2c7e labeled
pod/my-nginx-2035384211-u3t6x labeled
This first filters all pods with the label "app=nginx", and then labels them with the "tier=fe".
To see the pods you labeled, run:
kubectl get pods -l app=nginx -L tier
NAME                        READY     STATUS    RESTARTS   AGE       TIER
my-nginx-2035384211-j5fhi   1/1       Running   0          23m       fe
my-nginx-2035384211-u2c7e   1/1       Running   0          23m       fe
my-nginx-2035384211-u3t6x   1/1       Running   0          23m       fe
This outputs all "app=nginx" pods, with an additional label column of pods' tier (specified with
-L or --label-columns).
For more information, please see labels
and kubectl label.
Updating annotations
Sometimes you would want to attach annotations to resources. Annotations are arbitrary
non-identifying metadata for retrieval by API clients such as tools, libraries, etc.
This can be done with kubectl annotate. For example:
kubectl annotate pods my-nginx-v4-9gw19 description='my frontend running nginx'
kubectl get pods my-nginx-v4-9gw19 -o yaml
apiVersion: v1
kind: pod
metadata:
  annotations:
    description: my frontend running nginx
...
For more information, see annotations
and kubectl annotate document.
Scaling your application
When load on your application grows or shrinks, use kubectl to scale your application.
For instance, to decrease the number of nginx replicas from 3 to 1, do:
kubectl scale deployment/my-nginx --replicas=1
deployment.apps/my-nginx scaled
Now you only have one pod managed by the deployment.
kubectl get pods -l app=nginx
NAME                        READY     STATUS    RESTARTS   AGE
my-nginx-2035384211-j5fhi   1/1       Running   0          30m
To have the system automatically choose the number of nginx replicas as needed,
ranging from 1 to 3, do:
kubectl autoscale deployment/my-nginx --min=1 --max=3
horizontalpodautoscaler.autoscaling/my-nginx autoscaled
Now your nginx replicas will be scaled up and down as needed, automatically.
For more information, please see kubectl scale,
kubectl autoscale and
horizontal pod autoscaler document.
In-place updates of resources
Sometimes it's necessary to make narrow, non-disruptive updates to resources you've created.
kubectl apply
It is suggested to maintain a set of configuration files in source control
(see configuration as code),
so that they can be maintained and versioned along with the code for the resources they configure.
Then, you can use kubectl apply
to push your configuration changes to the cluster.
This command will compare the version of the configuration that you're pushing with the previous
version and apply the changes you've made, without overwriting any automated changes to properties
you haven't specified.
kubectl apply -f https://k8s.io/examples/application/nginx/nginx-deployment.yaml
deployment.apps/my-nginx configured
Note that kubectl apply attaches an annotation to the resource in order to determine the changes
to the configuration since the previous invocation. When it's invoked, kubectl apply does a
three-way diff between the previous configuration, the provided input and the current
configuration of the resource, in order to determine how to modify the resource.
Currently, resources are created without this annotation, so the first invocation of kubectl apply will fall back to a two-way diff between the provided input and the current configuration
of the resource. During this first invocation, it cannot detect the deletion of properties set
when the resource was created. For this reason, it will not remove them.
All subsequent calls to kubectl apply, and other commands that modify the configuration, such as
kubectl replace and kubectl edit, will update the annotation, allowing subsequent calls to
kubectl apply to detect and perform deletions using a three-way diff.
kubectl edit
Alternatively, you may also update resources with kubectl edit:
kubectl edit deployment/my-nginx
This is equivalent to first get the resource, edit it in text editor, and then apply the
resource with the updated version:
kubectl get deployment my-nginx -o yaml > /tmp/nginx.yaml
vi /tmp/nginx.yaml
# do some edit, and then save the file

kubectl apply -f /tmp/nginx.yaml
deployment.apps/my-nginx configured

rm /tmp/nginx.yaml
This allows you to do more significant changes more easily. Note that you can specify the editor
with your EDITOR or KUBE_EDITOR environment variables.
For more information, please see kubectl edit document.
kubectl patch
You can use kubectl patch to update API objects in place. This command supports JSON patch,
JSON merge patch, and strategic merge patch. See
Update API Objects in Place Using kubectl patch
and
kubectl patch.
Disruptive updates
In some cases, you may need to update resource fields that cannot be updated once initialized, or
you may want to make a recursive change immediately, such as to fix broken pods created by a
Deployment. To change such fields, use replace --force, which deletes and re-creates the
resource. In this case, you can modify your original configuration file:
kubectl replace -f https://k8s.io/examples/application/nginx/nginx-deployment.yaml --force
deployment.apps/my-nginx deleted
deployment.apps/my-nginx replaced
Updating your application without a service outage
At some point, you'll eventually need to update your deployed application, typically by specifying
a new image or image tag, as in the canary deployment scenario above. kubectl supports several
update operations, each of which is applicable to different scenarios.
We'll guide you through how to create and update applications with Deployments.
Let's say you were running version 1.14.2 of nginx:
kubectl create deployment my-nginx --image=nginx:1.14.2
deployment.apps/my-nginx created
with 3 replicas (so the old and new revisions can coexist):
kubectl scale deployment my-nginx --current-replicas=1 --replicas=3
deployment.apps/my-nginx scaled
To update to version 1.16.1, change .spec.template.spec.containers[0].image from nginx:1.14.2
to nginx:1.16.1 using the previous kubectl commands.
kubectl edit deployment/my-nginx
That's it! The Deployment will declaratively update the deployed nginx application progressively
behind the scene. It ensures that only a certain number of old replicas may be down while they are
being updated, and only a certain number of new replicas may be created above the desired number
of pods. To learn more details about it, visit Deployment page.
What's next
3 - Cluster Networking
Networking is a central part of Kubernetes, but it can be challenging to
understand exactly how it is expected to work. There are 4 distinct networking
problems to address:
- Highly-coupled container-to-container communications: this is solved by
Pods and
localhost communications.
- Pod-to-Pod communications: this is the primary focus of this document.
- Pod-to-Service communications: this is covered by Services.
- External-to-Service communications: this is also covered by Services.
Kubernetes is all about sharing machines between applications. Typically,
sharing machines requires ensuring that two applications do not try to use the
same ports. Coordinating ports across multiple developers is very difficult to
do at scale and exposes users to cluster-level issues outside of their control.
Dynamic port allocation brings a lot of complications to the system - every
application has to take ports as flags, the API servers have to know how to
insert dynamic port numbers into configuration blocks, services have to know
how to find each other, etc. Rather than deal with this, Kubernetes takes a
different approach.
To learn about the Kubernetes networking model, see here.
How to implement the Kubernetes network model
The network model is implemented by the container runtime on each node. The most common container runtimes use Container Network Interface (CNI) plugins to manage their network and security capabilities. Many different CNI plugins exist from many different vendors. Some of these provide only basic features of adding and removing network interfaces, while others provide more sophisticated solutions, such as integration with other container orchestration systems, running multiple CNI plugins, advanced IPAM features etc.
See this page for a non-exhaustive list of networking addons supported by Kubernetes.
What's next
The early design of the networking model and its rationale, and some future
plans are described in more detail in the
networking design document.
4 - Logging Architecture
Application logs can help you understand what is happening inside your application. The
logs are particularly useful for debugging problems and monitoring cluster activity. Most
modern applications have some kind of logging mechanism. Likewise, container engines
are designed to support logging. The easiest and most adopted logging method for
containerized applications is writing to standard output and standard error streams.
However, the native functionality provided by a container engine or runtime is usually
not enough for a complete logging solution.
For example, you may want to access your application's logs if a container crashes,
a pod gets evicted, or a node dies.
In a cluster, logs should have a separate storage and lifecycle independent of nodes,
pods, or containers. This concept is called
cluster-level logging.
Cluster-level logging architectures require a separate backend to store, analyze, and
query logs. Kubernetes does not provide a native storage solution for log data. Instead,
there are many logging solutions that integrate with Kubernetes. The following sections
describe how to handle and store logs on nodes.
Pod and container logs
Kubernetes captures logs from each container in a running Pod.
This example uses a manifest for a Pod with a container
that writes text to the standard output stream, once per second.
apiVersion: v1
kind: Pod
metadata:
  name: counter
spec:
  containers:
  - name: count
    image: busybox:1.28
    args: [/bin/sh, -c,
            'i=0; while true; do echo "$i: $(date)"; i=$((i+1)); sleep 1; done']
To run this pod, use the following command:
kubectl apply -f https://k8s.io/examples/debug/counter-pod.yaml
The output is:
To fetch the logs, use the kubectl logs command, as follows:
The output is similar to:
0: Fri Apr  1 11:42:23 UTC 2022
1: Fri Apr  1 11:42:24 UTC 2022
2: Fri Apr  1 11:42:25 UTC 2022
You can use kubectl logs --previous to retrieve logs from a previous instantiation of a container.
If your pod has multiple containers, specify which container's logs you want to access by
appending a container name to the command, with a -c flag, like so:
kubectl logs counter -c count
See the kubectl logs documentation for more details.
How nodes handle container logs
A container runtime handles and redirects any output generated to a containerized application's stdout and stderr streams.
Different container runtimes implement this in different ways; however, the integration with the kubelet is standardized
as the CRI logging format.
By default, if a container restarts, the kubelet keeps one terminated container with its logs. If a pod is evicted from the node,
all corresponding containers are also evicted, along with their logs.
The kubelet makes logs available to clients via a special feature of the Kubernetes API. The usual way to access this is
by running kubectl logs.
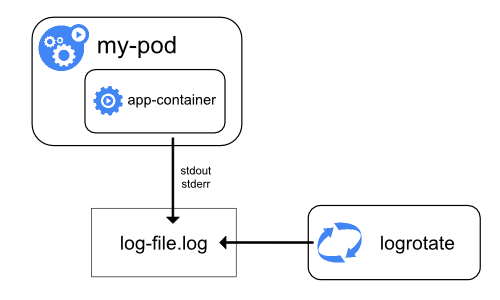
Log rotation
FEATURE STATE: Kubernetes v1.21 [stable]
You can configure the kubelet to rotate logs automatically.
If you configure rotation, the kubelet is responsible for rotating container logs and managing the logging directory structure.
The kubelet sends this information to the container runtime (using CRI),
and the runtime writes the container logs to the given location.
You can configure two kubelet configuration settings,
containerLogMaxSize and containerLogMaxFiles,
using the kubelet configuration file.
These settings let you configure the maximum size for each log file and the maximum number of files allowed for each container respectively.
When you run kubectl logs as in
the basic logging example, the kubelet on the node handles the request and
reads directly from the log file. The kubelet returns the content of the log file.
Note: Only the contents of the latest log file are available through
kubectl logs.
For example, if a Pod writes 40 MiB of logs and the kubelet rotates logs
after 10 MiB, running kubectl logs returns at most 10MiB of data.
System component logs
There are two types of system components: those that typically run in a container,
and those components directly involved in running containers. For example:
- The kubelet and container runtime do not run in containers. The kubelet runs
your containers (grouped together in pods)
- The Kubernetes scheduler, controller manager, and API server run within pods
(usually static Pods).
The etcd component runs in the control plane, and most commonly also as a static pod.
If your cluster uses kube-proxy, you typically run this as a
DaemonSet.
Log locations
The way that the kubelet and container runtime write logs depends on the operating
system that the node uses:
On Linux nodes that use systemd, the kubelet and container runtime write to journald
by default. You use journalctl to read the systemd journal; for example:
journalctl -u kubelet.
If systemd is not present, the kubelet and container runtime write to .log files in the
/var/log directory. If you want to have logs written elsewhere, you can indirectly
run the kubelet via a helper tool, kube-log-runner, and use that tool to redirect
kubelet logs to a directory that you choose.
You can also set a logging directory using the deprecated kubelet command line
argument --log-dir. However, the kubelet always directs your container runtime to
write logs into directories within /var/log/pods.
For more information on kube-log-runner, read System Logs.
By default, the kubelet writes logs to files within the directory C:\var\logs
(notice that this is not C:\var\log).
Although C:\var\log is the Kubernetes default location for these logs, several
cluster deployment tools set up Windows nodes to log to C:\var\log\kubelet instead.
If you want to have logs written elsewhere, you can indirectly
run the kubelet via a helper tool, kube-log-runner, and use that tool to redirect
kubelet logs to a directory that you choose.
However, the kubelet always directs your container runtime to write logs within the
directory C:\var\log\pods.
For more information on kube-log-runner, read System Logs.
For Kubernetes cluster components that run in pods, these write to files inside
the /var/log directory, bypassing the default logging mechanism (the components
do not write to the systemd journal). You can use Kubernetes' storage mechanisms
to map persistent storage into the container that runs the component.
For details about etcd and its logs, view the etcd documentation.
Again, you can use Kubernetes' storage mechanisms to map persistent storage into
the container that runs the component.
Note: If you deploy Kubernetes cluster components (such as the scheduler) to log to
a volume shared from the parent node, you need to consider and ensure that those
logs are rotated. Kubernetes does not manage that log rotation.
Your operating system may automatically implement some log rotation - for example,
if you share the directory /var/log into a static Pod for a component, node-level
log rotation treats a file in that directory the same as a file written by any component
outside Kubernetes.
Some deploy tools account for that log rotation and automate it; others leave this
as your responsibility.
Cluster-level logging architectures
While Kubernetes does not provide a native solution for cluster-level logging, there are several common approaches you can consider. Here are some options:
- Use a node-level logging agent that runs on every node.
- Include a dedicated sidecar container for logging in an application pod.
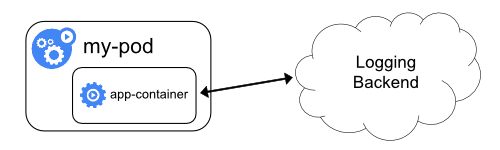
- Push logs directly to a backend from within an application.
Using a node logging agent
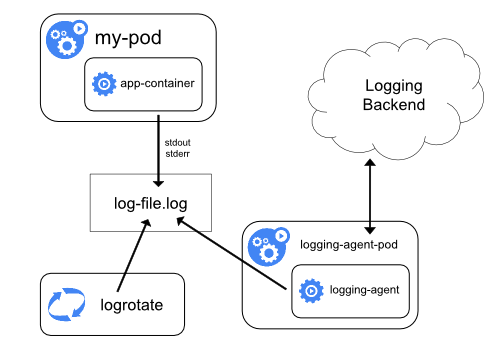
You can implement cluster-level logging by including a node-level logging agent on each node. The logging agent is a dedicated tool that exposes logs or pushes logs to a backend. Commonly, the logging agent is a container that has access to a directory with log files from all of the application containers on that node.
Because the logging agent must run on every node, it is recommended to run the agent
as a DaemonSet.
Node-level logging creates only one agent per node and doesn't require any changes to the applications running on the node.
Containers write to stdout and stderr, but with no agreed format. A node-level agent collects these logs and forwards them for aggregation.
Using a sidecar container with the logging agent
You can use a sidecar container in one of the following ways:
- The sidecar container streams application logs to its own
stdout.
- The sidecar container runs a logging agent, which is configured to pick up logs from an application container.
Streaming sidecar container
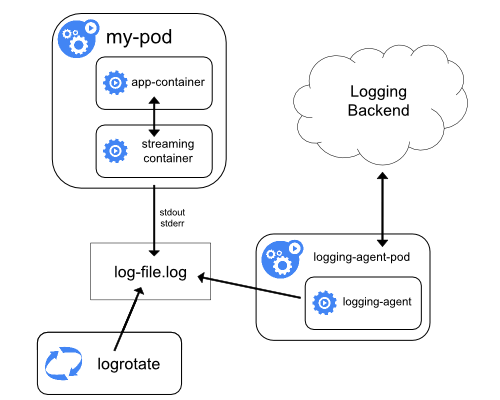
By having your sidecar containers write to their own stdout and stderr
streams, you can take advantage of the kubelet and the logging agent that
already run on each node. The sidecar containers read logs from a file, a socket,
or journald. Each sidecar container prints a log to its own stdout or stderr stream.
This approach allows you to separate several log streams from different
parts of your application, some of which can lack support
for writing to stdout or stderr. The logic behind redirecting logs
is minimal, so it's not a significant overhead. Additionally, because
stdout and stderr are handled by the kubelet, you can use built-in tools
like kubectl logs.
For example, a pod runs a single container, and the container
writes to two different log files using two different formats. Here's a
manifest for the Pod:
apiVersion: v1
kind: Pod
metadata:
  name: counter
spec:
  containers:
  - name: count
    image: busybox:1.28
    args:
    - /bin/sh
    - -c
    - >
      i=0;
      while true;
      do
        echo "$i: $(date)" >> /var/log/1.log;
        echo "$(date) INFO $i" >> /var/log/2.log;
        i=$((i+1));
        sleep 1;
      done
    volumeMounts:
    - name: varlog
      mountPath: /var/log
  volumes:
  - name: varlog
    emptyDir: {}
It is not recommended to write log entries with different formats to the same log
stream, even if you managed to redirect both components to the stdout stream of
the container. Instead, you can create two sidecar containers. Each sidecar
container could tail a particular log file from a shared volume and then redirect
the logs to its own stdout stream.
Here's a manifest for a pod that has two sidecar containers:
apiVersion: v1
kind: Pod
metadata:
  name: counter
spec:
  containers:
  - name: count
    image: busybox:1.28
    args:
    - /bin/sh
    - -c
    - >
      i=0;
      while true;
      do
        echo "$i: $(date)" >> /var/log/1.log;
        echo "$(date) INFO $i" >> /var/log/2.log;
        i=$((i+1));
        sleep 1;
      done
    volumeMounts:
    - name: varlog
      mountPath: /var/log
  - name: count-log-1
    image: busybox:1.28
    args: [/bin/sh, -c, 'tail -n+1 -F /var/log/1.log']
    volumeMounts:
    - name: varlog
      mountPath: /var/log
  - name: count-log-2
    image: busybox:1.28
    args: [/bin/sh, -c, 'tail -n+1 -F /var/log/2.log']
    volumeMounts:
    - name: varlog
      mountPath: /var/log
  volumes:
  - name: varlog
    emptyDir: {}
Now when you run this pod, you can access each log stream separately by
running the following commands:
kubectl logs counter count-log-1
The output is similar to:
0: Fri Apr  1 11:42:26 UTC 2022
1: Fri Apr  1 11:42:27 UTC 2022
2: Fri Apr  1 11:42:28 UTC 2022
...
kubectl logs counter count-log-2
The output is similar to:
Fri Apr  1 11:42:29 UTC 2022 INFO 0
Fri Apr  1 11:42:30 UTC 2022 INFO 0
Fri Apr  1 11:42:31 UTC 2022 INFO 0
...
If you installed a node-level agent in your cluster, that agent picks up those log
streams automatically without any further configuration. If you like, you can configure
the agent to parse log lines depending on the source container.
Even for Pods that only have low CPU and memory usage (order of a couple of millicores
for cpu and order of several megabytes for memory), writing logs to a file and
then streaming them to stdout can double how much storage you need on the node.
If you have an application that writes to a single file, it's recommended to set
/dev/stdout as the destination rather than implement the streaming sidecar
container approach.
Sidecar containers can also be used to rotate log files that cannot be rotated by
the application itself. An example of this approach is a small container running
logrotate periodically.
However, it's more straightforward to use stdout and stderr directly, and
leave rotation and retention policies to the kubelet.
Sidecar container with a logging agent
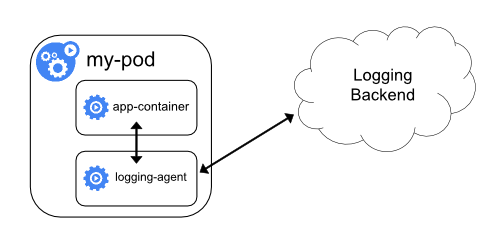
If the node-level logging agent is not flexible enough for your situation, you
can create a sidecar container with a separate logging agent that you have
configured specifically to run with your application.
Note: Using a logging agent in a sidecar container can lead
to significant resource consumption. Moreover, you won't be able to access
those logs using kubectl logs because they are not controlled
by the kubelet.
Here are two example manifests that you can use to implement a sidecar container with a logging agent.
The first manifest contains a ConfigMap
to configure fluentd.
apiVersion: v1
kind: ConfigMap
metadata:
  name: fluentd-config
data:
  fluentd.conf: |
    <source>
      type tail
      format none
      path /var/log/1.log
      pos_file /var/log/1.log.pos
      tag count.format1
    </source>

    <source>
      type tail
      format none
      path /var/log/2.log
      pos_file /var/log/2.log.pos
      tag count.format2
    </source>

    <match **>
      type google_cloud
    </match>
Note: In the sample configurations, you can replace fluentd with any logging agent, reading
from any source inside an application container.
The second manifest describes a pod that has a sidecar container running fluentd.
The pod mounts a volume where fluentd can pick up its configuration data.
apiVersion: v1
kind: Pod
metadata:
  name: counter
spec:
  containers:
  - name: count
    image: busybox:1.28
    args:
    - /bin/sh
    - -c
    - >
      i=0;
      while true;
      do
        echo "$i: $(date)" >> /var/log/1.log;
        echo "$(date) INFO $i" >> /var/log/2.log;
        i=$((i+1));
        sleep 1;
      done
    volumeMounts:
    - name: varlog
      mountPath: /var/log
  - name: count-agent
    image: registry.k8s.io/fluentd-gcp:1.30
    env:
    - name: FLUENTD_ARGS
      value: -c /etc/fluentd-config/fluentd.conf
    volumeMounts:
    - name: varlog
      mountPath: /var/log
    - name: config-volume
      mountPath: /etc/fluentd-config
  volumes:
  - name: varlog
    emptyDir: {}
  - name: config-volume
    configMap:
      name: fluentd-config
Exposing logs directly from the application
Cluster-logging that exposes or pushes logs directly from every application is outside the scope of Kubernetes.
What's next
5 - Metrics For Kubernetes System Components
System component metrics can give a better look into what is happening inside them. Metrics are
particularly useful for building dashboards and alerts.
Kubernetes components emit metrics in Prometheus format.
This format is structured plain text, designed so that people and machines can both read it.
Metrics in Kubernetes
In most cases metrics are available on /metrics endpoint of the HTTP server. For components that
doesn't expose endpoint by default it can be enabled using --bind-address flag.
Examples of those components:
In a production environment you may want to configure Prometheus Server
or some other metrics scraper to periodically gather these metrics and make them available in some
kind of time series database.
Note that kubelet also exposes metrics in
/metrics/cadvisor, /metrics/resource and /metrics/probes endpoints. Those metrics do not
have same lifecycle.
If your cluster uses RBAC, reading metrics requires
authorization via a user, group or ServiceAccount with a ClusterRole that allows accessing
/metrics. For example:
apiVersion: rbac.authorization.k8s.io/v1
kind: ClusterRole
metadata:
  name: prometheus
rules:
  - nonResourceURLs:
      - "/metrics"
    verbs:
      - get
Metric lifecycle
Alpha metric → Stable metric → Deprecated metric → Hidden metric → Deleted metric
Alpha metrics have no stability guarantees. These metrics can be modified or deleted at any time.
Stable metrics are guaranteed to not change. This means:
- A stable metric without a deprecated signature will not be deleted or renamed
- A stable metric's type will not be modified
Deprecated metrics are slated for deletion, but are still available for use.
These metrics include an annotation about the version in which they became deprecated.
For example:
Hidden metrics are no longer published for scraping, but are still available for use. To use a
hidden metric, please refer to the Show hidden metrics section.
Deleted metrics are no longer published and cannot be used.
Show hidden metrics
As described above, admins can enable hidden metrics through a command-line flag on a specific
binary. This intends to be used as an escape hatch for admins if they missed the migration of the
metrics deprecated in the last release.
The flag show-hidden-metrics-for-version takes a version for which you want to show metrics
deprecated in that release. The version is expressed as x.y, where x is the major version, y is
the minor version. The patch version is not needed even though a metrics can be deprecated in a
patch release, the reason for that is the metrics deprecation policy runs against the minor release.
The flag can only take the previous minor version as it's value. All metrics hidden in previous
will be emitted if admins set the previous version to show-hidden-metrics-for-version. The too
old version is not allowed because this violates the metrics deprecated policy.
Take metric A as an example, here assumed that A is deprecated in 1.n. According to metrics
deprecated policy, we can reach the following conclusion:
- In release
1.n, the metric is deprecated, and it can be emitted by default.
- In release
1.n+1, the metric is hidden by default and it can be emitted by command line
show-hidden-metrics-for-version=1.n.
- In release
1.n+2, the metric should be removed from the codebase. No escape hatch anymore.
If you're upgrading from release 1.12 to 1.13, but still depend on a metric A deprecated in
1.12, you should set hidden metrics via command line: --show-hidden-metrics=1.12 and remember
to remove this metric dependency before upgrading to 1.14
Disable accelerator metrics
The kubelet collects accelerator metrics through cAdvisor. To collect these metrics, for
accelerators like NVIDIA GPUs, kubelet held an open handle on the driver. This meant that in order
to perform infrastructure changes (for example, updating the driver), a cluster administrator
needed to stop the kubelet agent.
The responsibility for collecting accelerator metrics now belongs to the vendor rather than the
kubelet. Vendors must provide a container that collects metrics and exposes them to the metrics
service (for example, Prometheus).
The DisableAcceleratorUsageMetrics feature gate
disables metrics collected by the kubelet, with a
timeline for enabling this feature by default.
Component metrics
kube-controller-manager metrics
Controller manager metrics provide important insight into the performance and health of the
controller manager. These metrics include common Go language runtime metrics such as go_routine
count and controller specific metrics such as etcd request latencies or Cloudprovider (AWS, GCE,
OpenStack) API latencies that can be used to gauge the health of a cluster.
Starting from Kubernetes 1.7, detailed Cloudprovider metrics are available for storage operations
for GCE, AWS, Vsphere and OpenStack.
These metrics can be used to monitor health of persistent volume operations.
For example, for GCE these metrics are called:
cloudprovider_gce_api_request_duration_seconds { request = "instance_list"}
cloudprovider_gce_api_request_duration_seconds { request = "disk_insert"}
cloudprovider_gce_api_request_duration_seconds { request = "disk_delete"}
cloudprovider_gce_api_request_duration_seconds { request = "attach_disk"}
cloudprovider_gce_api_request_duration_seconds { request = "detach_disk"}
cloudprovider_gce_api_request_duration_seconds { request = "list_disk"}
kube-scheduler metrics
FEATURE STATE: Kubernetes v1.21 [beta]
The scheduler exposes optional metrics that reports the requested resources and the desired limits
of all running pods. These metrics can be used to build capacity planning dashboards, assess
current or historical scheduling limits, quickly identify workloads that cannot schedule due to
lack of resources, and compare actual usage to the pod's request.
The kube-scheduler identifies the resource requests and limits
configured for each Pod; when either a request or limit is non-zero, the kube-scheduler reports a
metrics timeseries. The time series is labelled by:
- namespace
- pod name
- the node where the pod is scheduled or an empty string if not yet scheduled
- priority
- the assigned scheduler for that pod
- the name of the resource (for example,
cpu)
- the unit of the resource if known (for example,
cores)
Once a pod reaches completion (has a restartPolicy of Never or OnFailure and is in the
Succeeded or Failed pod phase, or has been deleted and all containers have a terminated state)
the series is no longer reported since the scheduler is now free to schedule other pods to run.
The two metrics are called kube_pod_resource_request and kube_pod_resource_limit.
The metrics are exposed at the HTTP endpoint /metrics/resources and require the same
authorization as the /metrics endpoint on the scheduler. You must use the
--show-hidden-metrics-for-version=1.20 flag to expose these alpha stability metrics.
Disabling metrics
You can explicitly turn off metrics via command line flag --disabled-metrics. This may be
desired if, for example, a metric is causing a performance problem. The input is a list of
disabled metrics (i.e. --disabled-metrics=metric1,metric2).
Metric cardinality enforcement
Metrics with unbounded dimensions could cause memory issues in the components they instrument. To
limit resource use, you can use the --allow-label-value command line option to dynamically
configure an allow-list of label values for a metric.
In alpha stage, the flag can only take in a series of mappings as metric label allow-list.
Each mapping is of the format <metric_name>,<label_name>=<allowed_labels> where
<allowed_labels> is a comma-separated list of acceptable label names.
The overall format looks like:
--allow-label-value <metric_name>,<label_name>='<allow_value1>, <allow_value2>...', <metric_name2>,<label_name>='<allow_value1>, <allow_value2>...', ...
Here is an example:
--allow-label-value number_count_metric,odd_number='1,3,5', number_count_metric,even_number='2,4,6', date_gauge_metric,weekend='Saturday,Sunday'
What's next
6 - System Logs
System component logs record events happening in cluster, which can be very useful for debugging.
You can configure log verbosity to see more or less detail.
Logs can be as coarse-grained as showing errors within a component, or as fine-grained as showing
step-by-step traces of events (like HTTP access logs, pod state changes, controller actions, or
scheduler decisions).
Klog
klog is the Kubernetes logging library. klog
generates log messages for the Kubernetes system components.
For more information about klog configuration, see the Command line tool reference.
Kubernetes is in the process of simplifying logging in its components.
The following klog command line flags
are deprecated
starting with Kubernetes 1.23 and will be removed in a future release:
--add-dir-header--alsologtostderr--log-backtrace-at--log-dir--log-file--log-file-max-size--logtostderr--one-output--skip-headers--skip-log-headers--stderrthreshold
Output will always be written to stderr, regardless of the output format. Output redirection is
expected to be handled by the component which invokes a Kubernetes component. This can be a POSIX
shell or a tool like systemd.
In some cases, for example a distroless container or a Windows system service, those options are
not available. Then the
kube-log-runner
binary can be used as wrapper around a Kubernetes component to redirect
output. A prebuilt binary is included in several Kubernetes base images under
its traditional name as /go-runner and as kube-log-runner in server and
node release archives.
This table shows how kube-log-runner invocations correspond to shell redirection:
| Usage |
POSIX shell (such as bash) |
kube-log-runner <options> <cmd> |
| Merge stderr and stdout, write to stdout |
2>&1 |
kube-log-runner (default behavior) |
| Redirect both into log file |
1>>/tmp/log 2>&1 |
kube-log-runner -log-file=/tmp/log |
| Copy into log file and to stdout |
2>&1 | tee -a /tmp/log |
kube-log-runner -log-file=/tmp/log -also-stdout |
| Redirect only stdout into log file |
>/tmp/log |
kube-log-runner -log-file=/tmp/log -redirect-stderr=false |
Klog output
An example of the traditional klog native format:
I1025 00:15:15.525108 1 httplog.go:79] GET /api/v1/namespaces/kube-system/pods/metrics-server-v0.3.1-57c75779f-9p8wg: (1.512ms) 200 [pod_nanny/v0.0.0 (linux/amd64) kubernetes/$Format 10.56.1.19:51756]
The message string may contain line breaks:
I1025 00:15:15.525108       1 example.go:79] This is a message
which has a line break.
Structured Logging
FEATURE STATE: Kubernetes v1.23 [beta]
Warning: Migration to structured log messages is an ongoing process. Not all log messages are structured in
this version. When parsing log files, you must also handle unstructured log messages.
Log formatting and value serialization are subject to change.
Structured logging introduces a uniform structure in log messages allowing for programmatic
extraction of information. You can store and process structured logs with less effort and cost.
The code which generates a log message determines whether it uses the traditional unstructured
klog output or structured logging.
The default formatting of structured log messages is as text, with a format that is backward
compatible with traditional klog:
<klog header> "<message>" <key1>="<value1>" <key2>="<value2>" ...
Example:
I1025 00:15:15.525108 1 controller_utils.go:116] "Pod status updated" pod="kube-system/kubedns" status="ready"
Strings are quoted. Other values are formatted with
%+v, which may cause log messages to
continue on the next line depending on the data.
I1025 00:15:15.525108       1 example.go:116] "Example" data="This is text with a line break\nand \"quotation marks\"." someInt=1 someFloat=0.1 someStruct={StringField: First line,
second line.}
Contextual Logging
FEATURE STATE: Kubernetes v1.24 [alpha]
Contextual logging builds on top of structured logging. It is primarily about
how developers use logging calls: code based on that concept is more flexible
and supports additional use cases as described in the Contextual Logging
KEP.
If developers use additional functions like WithValues or WithName in
their components, then log entries contain additional information that gets
passed into functions by their caller.
Currently this is gated behind the StructuredLogging feature gate and
disabled by default. The infrastructure for this was added in 1.24 without
modifying components. The
component-base/logs/example
command demonstrates how to use the new logging calls and how a component
behaves that supports contextual logging.
$ cd $GOPATH/src/k8s.io/kubernetes/staging/src/k8s.io/component-base/logs/example/cmd/
$ go run . --help
...
      --feature-gates mapStringBool  A set of key=value pairs that describe feature gates for alpha/experimental features. Options are:
                                     AllAlpha=true|false (ALPHA - default=false)
                                     AllBeta=true|false (BETA - default=false)
                                     ContextualLogging=true|false (ALPHA - default=false)
$ go run . --feature-gates ContextualLogging=true
...
I0404 18:00:02.916429  451895 logger.go:94] "example/myname: runtime" foo="bar" duration="1m0s"
I0404 18:00:02.916447  451895 logger.go:95] "example: another runtime" foo="bar" duration="1m0s"
The example prefix and foo="bar" were added by the caller of the function
which logs the runtime message and duration="1m0s" value, without having to
modify that function.
With contextual logging disable, WithValues and WithName do nothing and log
calls go through the global klog logger. Therefore this additional information
is not in the log output anymore:
$ go run . --feature-gates ContextualLogging=false
...
I0404 18:03:31.171945  452150 logger.go:94] "runtime" duration="1m0s"
I0404 18:03:31.171962  452150 logger.go:95] "another runtime" duration="1m0s"
FEATURE STATE: Kubernetes v1.19 [alpha]
Warning: JSON output does not support many standard klog flags. For list of unsupported klog flags, see the
Command line tool reference.
Not all logs are guaranteed to be written in JSON format (for example, during process start).
If you intend to parse logs, make sure you can handle log lines that are not JSON as well.
Field names and JSON serialization are subject to change.
The --logging-format=json flag changes the format of logs from klog native format to JSON format.
Example of JSON log format (pretty printed):
{
   "ts": 1580306777.04728,
   "v": 4,
   "msg": "Pod status updated",
   "pod":{
      "name": "nginx-1",
      "namespace": "default"
   },
   "status": "ready"
}
Keys with special meaning:
ts - timestamp as Unix time (required, float)v - verbosity (only for info and not for error messages, int)err - error string (optional, string)msg - message (required, string)
List of components currently supporting JSON format:
Log verbosity level
The -v flag controls log verbosity. Increasing the value increases the number of logged events.
Decreasing the value decreases the number of logged events. Increasing verbosity settings logs
increasingly less severe events. A verbosity setting of 0 logs only critical events.
Log location
There are two types of system components: those that run in a container and those
that do not run in a container. For example:
- The Kubernetes scheduler and kube-proxy run in a container.
- The kubelet and container runtime
do not run in containers.
On machines with systemd, the kubelet and container runtime write to journald.
Otherwise, they write to .log files in the /var/log directory.
System components inside containers always write to .log files in the /var/log directory,
bypassing the default logging mechanism.
Similar to the container logs, you should rotate system component logs in the /var/log directory.
In Kubernetes clusters created by the kube-up.sh script, log rotation is configured by the logrotate tool.
The logrotate tool rotates logs daily, or once the log size is greater than 100MB.
Log query
FEATURE STATE: Kubernetes v1.27 [alpha]
To help with debugging issues on nodes, Kubernetes v1.27 introduced a feature that allows viewing logs of services
running on the node. To use the feature, ensure that the NodeLogQuery
feature gate is enabled for that node, and that the
kubelet configuration options enableSystemLogHandler and enableSystemLogQuery are both set to true. On Linux
we assume that service logs are available via journald. On Windows we assume that service logs are available
in the application log provider. On both operating systems, logs are also available by reading files within
/var/log/.
Provided you are authorized to interact with node objects, you can try out this alpha feature on all your nodes or
just a subset. Here is an example to retrieve the kubelet service logs from a node:
# Fetch kubelet logs from a node named node-1.example
kubectl get --raw "/api/v1/nodes/node-1.example/proxy/logs/?query=kubelet"
You can also fetch files, provided that the files are in a directory that the kubelet allows for log
fetches. For example, you can fetch a log from /var/log on a Linux node:
kubectl get --raw "/api/v1/nodes/<insert-node-name-here>/proxy/logs/?query=/<insert-log-file-name-here>"
The kubelet uses heuristics to retrieve logs. This helps if you are not aware whether a given system service is
writing logs to the operating system's native logger like journald or to a log file in /var/log/. The heuristics
first checks the native logger and if that is not available attempts to retrieve the first logs from
/var/log/<servicename> or /var/log/<servicename>.log or /var/log/<servicename>/<servicename>.log.
The complete list of options that can be used are:
| Option |
Description |
boot |
boot show messages from a specific system boot |
pattern |
pattern filters log entries by the provided PERL-compatible regular expression |
query |
query specifies services(s) or files from which to return logs (required) |
sinceTime |
an RFC3339 timestamp from which to show logs (inclusive) |
untilTime |
an RFC3339 timestamp until which to show logs (inclusive) |
tailLines |
specify how many lines from the end of the log to retrieve; the default is to fetch the whole log |
Example of a more complex query:
# Fetch kubelet logs from a node named node-1.example that have the word "error"
kubectl get --raw "/api/v1/nodes/node-1.example/proxy/logs/?query=kubelet&pattern=error"
What's next
7 - Traces For Kubernetes System Components
FEATURE STATE: Kubernetes v1.27 [beta]
System component traces record the latency of and relationships between operations in the cluster.
Kubernetes components emit traces using the
OpenTelemetry Protocol
with the gRPC exporter and can be collected and routed to tracing backends using an
OpenTelemetry Collector.
Trace Collection
For a complete guide to collecting traces and using the collector, see
Getting Started with the OpenTelemetry Collector.
However, there are a few things to note that are specific to Kubernetes components.
By default, Kubernetes components export traces using the grpc exporter for OTLP on the
IANA OpenTelemetry port, 4317.
As an example, if the collector is running as a sidecar to a Kubernetes component,
the following receiver configuration will collect spans and log them to standard output:
receivers:
  otlp:
    protocols:
      grpc:
exporters:
  # Replace this exporter with the exporter for your backend
  logging:
    logLevel: debug
service:
  pipelines:
    traces:
      receivers: [otlp]
      exporters: [logging]
Component traces
kube-apiserver traces
The kube-apiserver generates spans for incoming HTTP requests, and for outgoing requests
to webhooks, etcd, and re-entrant requests. It propagates the
W3C Trace Context with outgoing requests
but does not make use of the trace context attached to incoming requests,
as the kube-apiserver is often a public endpoint.
Enabling tracing in the kube-apiserver
To enable tracing, provide the kube-apiserver with a tracing configuration file
with --tracing-config-file=<path-to-config>. This is an example config that records
spans for 1 in 10000 requests, and uses the default OpenTelemetry endpoint:
apiVersion: apiserver.config.k8s.io/v1beta1
kind: TracingConfiguration
# default value
#endpoint: localhost:4317
samplingRatePerMillion: 100
For more information about the TracingConfiguration struct, see
API server config API (v1beta1).
kubelet traces
FEATURE STATE: Kubernetes v1.27 [beta]
The kubelet CRI interface and authenticated http servers are instrumented to generate
trace spans. As with the apiserver, the endpoint and sampling rate are configurable.
Trace context propagation is also configured. A parent span's sampling decision is always respected.
A provided tracing configuration sampling rate will apply to spans without a parent.
Enabled without a configured endpoint, the default OpenTelemetry Collector receiver address of "localhost:4317" is set.
Enabling tracing in the kubelet
To enable tracing, apply the tracing configuration.
This is an example snippet of a kubelet config that records spans for 1 in 10000 requests, and uses the default OpenTelemetry endpoint:
apiVersion: kubelet.config.k8s.io/v1beta1
kind: KubeletConfiguration
featureGates:
  KubeletTracing: true
tracing:
  # default value
  #endpoint: localhost:4317
  samplingRatePerMillion: 100
If the samplingRatePerMillion is set to one million (1000000), then every
span will be sent to the exporter.
The kubelet in Kubernetes v1.27 collects spans from
the garbage collection, pod synchronization routine as well as every gRPC
method. Connected container runtimes like CRI-O and containerd can link the
traces to their exported spans to provide additional context of information.
Please note that exporting spans always comes with a small performance overhead
on the networking and CPU side, depending on the overall configuration of the
system. If there is any issue like that in a cluster which is running with
tracing enabled, then mitigate the problem by either reducing the
samplingRatePerMillion or disabling tracing completely by removing the
configuration.
Stability
Tracing instrumentation is still under active development, and may change
in a variety of ways. This includes span names, attached attributes,
instrumented endpoints, etc. Until this feature graduates to stable,
there are no guarantees of backwards compatibility for tracing instrumentation.
What's next
8 - Proxies in Kubernetes
This page explains proxies used with Kubernetes.
Proxies
There are several different proxies you may encounter when using Kubernetes:
-
The kubectl proxy:
- runs on a user's desktop or in a pod
- proxies from a localhost address to the Kubernetes apiserver
- client to proxy uses HTTP
- proxy to apiserver uses HTTPS
- locates apiserver
- adds authentication headers
-
The apiserver proxy:
- is a bastion built into the apiserver
- connects a user outside of the cluster to cluster IPs which otherwise might not be reachable
- runs in the apiserver processes
- client to proxy uses HTTPS (or http if apiserver so configured)
- proxy to target may use HTTP or HTTPS as chosen by proxy using available information
- can be used to reach a Node, Pod, or Service
- does load balancing when used to reach a Service
-
The kube proxy:
- runs on each node
- proxies UDP, TCP and SCTP
- does not understand HTTP
- provides load balancing
- is only used to reach services
-
A Proxy/Load-balancer in front of apiserver(s):
- existence and implementation varies from cluster to cluster (e.g. nginx)
- sits between all clients and one or more apiservers
- acts as load balancer if there are several apiservers.
-
Cloud Load Balancers on external services:
- are provided by some cloud providers (e.g. AWS ELB, Google Cloud Load Balancer)
- are created automatically when the Kubernetes service has type
LoadBalancer
- usually supports UDP/TCP only
- SCTP support is up to the load balancer implementation of the cloud provider
- implementation varies by cloud provider.
Kubernetes users will typically not need to worry about anything other than the first two types. The cluster admin
will typically ensure that the latter types are set up correctly.
Requesting redirects
Proxies have replaced redirect capabilities. Redirects have been deprecated.
9 - API Priority and Fairness
FEATURE STATE: Kubernetes v1.20 [beta]
Controlling the behavior of the Kubernetes API server in an overload situation
is a key task for cluster administrators. The kube-apiserver has some controls available
(i.e. the --max-requests-inflight and --max-mutating-requests-inflight
command-line flags) to limit the amount of outstanding work that will be
accepted, preventing a flood of inbound requests from overloading and
potentially crashing the API server, but these flags are not enough to ensure
that the most important requests get through in a period of high traffic.
The API Priority and Fairness feature (APF) is an alternative that improves upon
aforementioned max-inflight limitations. APF classifies
and isolates requests in a more fine-grained way. It also introduces
a limited amount of queuing, so that no requests are rejected in cases
of very brief bursts. Requests are dispatched from queues using a
fair queuing technique so that, for example, a poorly-behaved
controller need not
starve others (even at the same priority level).
This feature is designed to work well with standard controllers, which
use informers and react to failures of API requests with exponential
back-off, and other clients that also work this way.
Caution: Some requests classified as "long-running"—such as remote
command execution or log tailing—are not subject to the API
Priority and Fairness filter. This is also true for the
--max-requests-inflight flag without the API Priority and Fairness
feature enabled. API Priority and Fairness does apply to watch
requests. When API Priority and Fairness is disabled, watch requests
are not subject to the --max-requests-inflight limit.
Enabling/Disabling API Priority and Fairness
The API Priority and Fairness feature is controlled by a feature gate
and is enabled by default. See Feature
Gates
for a general explanation of feature gates and how to enable and
disable them. The name of the feature gate for APF is
"APIPriorityAndFairness". This feature also involves an API Group with: (a) a
v1alpha1 version and a v1beta1 version, disabled by default, and
(b) v1beta2 and v1beta3 versions, enabled by default. You can
disable the feature gate and API group beta versions by adding the
following command-line flags to your kube-apiserver invocation:
kube-apiserver \
--feature-gates=APIPriorityAndFairness=false \
--runtime-config=flowcontrol.apiserver.k8s.io/v1beta2=false,flowcontrol.apiserver.k8s.io/v1beta3=false \
 # …and other flags as usual
Alternatively, you can enable the v1alpha1 and v1beta1 versions of the API group
with --runtime-config=flowcontrol.apiserver.k8s.io/v1alpha1=true,flowcontrol.apiserver.k8s.io/v1beta1=true.
The command-line flag --enable-priority-and-fairness=false will disable the
API Priority and Fairness feature, even if other flags have enabled it.
Concepts
There are several distinct features involved in the API Priority and Fairness
feature. Incoming requests are classified by attributes of the request using
FlowSchemas, and assigned to priority levels. Priority levels add a degree of
isolation by maintaining separate concurrency limits, so that requests assigned
to different priority levels cannot starve each other. Within a priority level,
a fair-queuing algorithm prevents requests from different flows from starving
each other, and allows for requests to be queued to prevent bursty traffic from
causing failed requests when the average load is acceptably low.
Priority Levels
Without APF enabled, overall concurrency in the API server is limited by the
kube-apiserver flags --max-requests-inflight and
--max-mutating-requests-inflight. With APF enabled, the concurrency limits
defined by these flags are summed and then the sum is divided up among a
configurable set of priority levels. Each incoming request is assigned to a
single priority level, and each priority level will only dispatch as many
concurrent requests as its particular limit allows.
The default configuration, for example, includes separate priority levels for
leader-election requests, requests from built-in controllers, and requests from
Pods. This means that an ill-behaved Pod that floods the API server with
requests cannot prevent leader election or actions by the built-in controllers
from succeeding.
The concurrency limits of the priority levels are periodically
adjusted, allowing under-utilized priority levels to temporarily lend
concurrency to heavily-utilized levels. These limits are based on
nominal limits and bounds on how much concurrency a priority level may
lend and how much it may borrow, all derived from the configuration
objects mentioned below.
Seats Occupied by a Request
The above description of concurrency management is the baseline story.
In it, requests have different durations but are counted equally at
any given moment when comparing against a priority level's concurrency
limit. In the baseline story, each request occupies one unit of
concurrency. The word "seat" is used to mean one unit of concurrency,
inspired by the way each passenger on a train or aircraft takes up one
of the fixed supply of seats.
But some requests take up more than one seat. Some of these are list
requests that the server estimates will return a large number of
objects. These have been found to put an exceptionally heavy burden
on the server, among requests that take a similar amount of time to
run. For this reason, the server estimates the number of objects that
will be returned and considers the request to take a number of seats
that is proportional to that estimated number.
Execution time tweaks for watch requests
API Priority and Fairness manages watch requests, but this involves a
couple more excursions from the baseline behavior. The first concerns
how long a watch request is considered to occupy its seat. Depending
on request parameters, the response to a watch request may or may not
begin with create notifications for all the relevant pre-existing
objects. API Priority and Fairness considers a watch request to be
done with its seat once that initial burst of notifications, if any,
is over.
The normal notifications are sent in a concurrent burst to all
relevant watch response streams whenever the server is notified of an
object create/update/delete. To account for this work, API Priority
and Fairness considers every write request to spend some additional
time occupying seats after the actual writing is done. The server
estimates the number of notifications to be sent and adjusts the write
request's number of seats and seat occupancy time to include this
extra work.
Queuing
Even within a priority level there may be a large number of distinct sources of
traffic. In an overload situation, it is valuable to prevent one stream of
requests from starving others (in particular, in the relatively common case of a
single buggy client flooding the kube-apiserver with requests, that buggy client
would ideally not have much measurable impact on other clients at all). This is
handled by use of a fair-queuing algorithm to process requests that are assigned
the same priority level. Each request is assigned to a flow, identified by the
name of the matching FlowSchema plus a flow distinguisher — which
is either the requesting user, the target resource's namespace, or nothing — and the
system attempts to give approximately equal weight to requests in different
flows of the same priority level.
To enable distinct handling of distinct instances, controllers that have
many instances should authenticate with distinct usernames
After classifying a request into a flow, the API Priority and Fairness
feature then may assign the request to a queue. This assignment uses
a technique known as shuffle sharding, which makes relatively efficient use of
queues to insulate low-intensity flows from high-intensity flows.
The details of the queuing algorithm are tunable for each priority level, and
allow administrators to trade off memory use, fairness (the property that
independent flows will all make progress when total traffic exceeds capacity),
tolerance for bursty traffic, and the added latency induced by queuing.
Exempt requests
Some requests are considered sufficiently important that they are not subject to
any of the limitations imposed by this feature. These exemptions prevent an
improperly-configured flow control configuration from totally disabling an API
server.
Resources
The flow control API involves two kinds of resources.
PriorityLevelConfigurations
define the available priority levels, the share of the available concurrency
budget that each can handle, and allow for fine-tuning queuing behavior.
FlowSchemas
are used to classify individual inbound requests, matching each to a
single PriorityLevelConfiguration. There is also a v1alpha1 version
of the same API group, and it has the same Kinds with the same syntax and
semantics.
PriorityLevelConfiguration
A PriorityLevelConfiguration represents a single priority level. Each
PriorityLevelConfiguration has an independent limit on the number of outstanding
requests, and limitations on the number of queued requests.
The nominal oncurrency limit for a PriorityLevelConfiguration is not
specified in an absolute number of seats, but rather in "nominal
concurrency shares." The total concurrency limit for the API Server is
distributed among the existing PriorityLevelConfigurations in
proportion to these shares, to give each level its nominal limit in
terms of seats. This allows a cluster administrator to scale up or
down the total amount of traffic to a server by restarting
kube-apiserver with a different value for --max-requests-inflight
(or --max-mutating-requests-inflight), and all
PriorityLevelConfigurations will see their maximum allowed concurrency
go up (or down) by the same fraction.
Caution: In the versions before v1beta3 the relevant
PriorityLevelConfiguration field is named "assured concurrency shares"
rather than "nominal concurrency shares". Also, in Kubernetes release
1.25 and earlier there were no periodic adjustments: the
nominal/assured limits were always applied without adjustment.
The bounds on how much concurrency a priority level may lend and how
much it may borrow are expressed in the PriorityLevelConfiguration as
percentages of the level's nominal limit. These are resolved to
absolute numbers of seats by multiplying with the nominal limit /
100.0 and rounding. The dynamically adjusted concurrency limit of a
priority level is constrained to lie between (a) a lower bound of its
nominal limit minus its lendable seats and (b) an upper bound of its
nominal limit plus the seats it may borrow. At each adjustment the
dynamic limits are derived by each priority level reclaiming any lent
seats for which demand recently appeared and then jointly fairly
responding to the recent seat demand on the priority levels, within
the bounds just described.
Caution: With the Priority and Fairness feature enabled, the total concurrency limit for
the server is set to the sum of --max-requests-inflight and
--max-mutating-requests-inflight. There is no longer any distinction made
between mutating and non-mutating requests; if you want to treat them
separately for a given resource, make separate FlowSchemas that match the
mutating and non-mutating verbs respectively.
When the volume of inbound requests assigned to a single
PriorityLevelConfiguration is more than its permitted concurrency level, the
type field of its specification determines what will happen to extra requests.
A type of Reject means that excess traffic will immediately be rejected with
an HTTP 429 (Too Many Requests) error. A type of Queue means that requests
above the threshold will be queued, with the shuffle sharding and fair queuing techniques used
to balance progress between request flows.
The queuing configuration allows tuning the fair queuing algorithm for a
priority level. Details of the algorithm can be read in the
enhancement proposal, but in short:
-
Increasing queues reduces the rate of collisions between different flows, at
the cost of increased memory usage. A value of 1 here effectively disables the
fair-queuing logic, but still allows requests to be queued.
-
Increasing queueLengthLimit allows larger bursts of traffic to be
sustained without dropping any requests, at the cost of increased
latency and memory usage.
-
Changing handSize allows you to adjust the probability of collisions between
different flows and the overall concurrency available to a single flow in an
overload situation.
Note: A larger handSize makes it less likely for two individual flows to collide
(and therefore for one to be able to starve the other), but more likely that
a small number of flows can dominate the apiserver. A larger handSize also
potentially increases the amount of latency that a single high-traffic flow
can cause. The maximum number of queued requests possible from a
single flow is handSize * queueLengthLimit.
Following is a table showing an interesting collection of shuffle
sharding configurations, showing for each the probability that a
given mouse (low-intensity flow) is squished by the elephants (high-intensity flows) for
an illustrative collection of numbers of elephants. See
https://play.golang.org/p/Gi0PLgVHiUg , which computes this table.
Example Shuffle Sharding Configurations
| HandSize |
Queues |
1 elephant |
4 elephants |
16 elephants |
| 12 |
32 |
4.428838398950118e-09 |
0.11431348830099144 |
0.9935089607656024 |
| 10 |
32 |
1.550093439632541e-08 |
0.0626479840223545 |
0.9753101519027554 |
| 10 |
64 |
6.601827268370426e-12 |
0.00045571320990370776 |
0.49999929150089345 |
| 9 |
64 |
3.6310049976037345e-11 |
0.00045501212304112273 |
0.4282314876454858 |
| 8 |
64 |
2.25929199850899e-10 |
0.0004886697053040446 |
0.35935114681123076 |
| 8 |
128 |
6.994461389026097e-13 |
3.4055790161620863e-06 |
0.02746173137155063 |
| 7 |
128 |
1.0579122850901972e-11 |
6.960839379258192e-06 |
0.02406157386340147 |
| 7 |
256 |
7.597695465552631e-14 |
6.728547142019406e-08 |
0.0006709661542533682 |
| 6 |
256 |
2.7134626662687968e-12 |
2.9516464018476436e-07 |
0.0008895654642000348 |
| 6 |
512 |
4.116062922897309e-14 |
4.982983350480894e-09 |
2.26025764343413e-05 |
| 6 |
1024 |
6.337324016514285e-16 |
8.09060164312957e-11 |
4.517408062903668e-07 |
FlowSchema
A FlowSchema matches some inbound requests and assigns them to a
priority level. Every inbound request is tested against every
FlowSchema in turn, starting with those with numerically lowest ---
which we take to be the logically highest --- matchingPrecedence and
working onward. The first match wins.
Caution: Only the first matching FlowSchema for a given request matters. If multiple
FlowSchemas match a single inbound request, it will be assigned based on the one
with the highest matchingPrecedence. If multiple FlowSchemas with equal
matchingPrecedence match the same request, the one with lexicographically
smaller name will win, but it's better not to rely on this, and instead to
ensure that no two FlowSchemas have the same matchingPrecedence.
A FlowSchema matches a given request if at least one of its rules
matches. A rule matches if at least one of its subjects and at least
one of its resourceRules or nonResourceRules (depending on whether the
incoming request is for a resource or non-resource URL) matches the request.
For the name field in subjects, and the verbs, apiGroups, resources,
namespaces, and nonResourceURLs fields of resource and non-resource rules,
the wildcard * may be specified to match all values for the given field,
effectively removing it from consideration.
A FlowSchema's distinguisherMethod.type determines how requests matching that
schema will be separated into flows. It may be
either ByUser, in which case one requesting user will not be able to starve
other users of capacity, or ByNamespace, in which case requests for resources
in one namespace will not be able to starve requests for resources in other
namespaces of capacity, or it may be blank (or distinguisherMethod may be
omitted entirely), in which case all requests matched by this FlowSchema will be
considered part of a single flow. The correct choice for a given FlowSchema
depends on the resource and your particular environment.
Defaults
Each kube-apiserver maintains two sorts of APF configuration objects:
mandatory and suggested.
Mandatory Configuration Objects
The four mandatory configuration objects reflect fixed built-in
guardrail behavior. This is behavior that the servers have before
those objects exist, and when those objects exist their specs reflect
this behavior. The four mandatory objects are as follows.
-
The mandatory exempt priority level is used for requests that are
not subject to flow control at all: they will always be dispatched
immediately. The mandatory exempt FlowSchema classifies all
requests from the system:masters group into this priority
level. You may define other FlowSchemas that direct other requests
to this priority level, if appropriate.
-
The mandatory catch-all priority level is used in combination with
the mandatory catch-all FlowSchema to make sure that every request
gets some kind of classification. Typically you should not rely on
this catch-all configuration, and should create your own catch-all
FlowSchema and PriorityLevelConfiguration (or use the suggested
global-default priority level that is installed by default) as
appropriate. Because it is not expected to be used normally, the
mandatory catch-all priority level has a very small concurrency
share and does not queue requests.
Suggested Configuration Objects
The suggested FlowSchemas and PriorityLevelConfigurations constitute a
reasonable default configuration. You can modify these and/or create
additional configuration objects if you want. If your cluster is
likely to experience heavy load then you should consider what
configuration will work best.
The suggested configuration groups requests into six priority levels:
-
The node-high priority level is for health updates from nodes.
-
The system priority level is for non-health requests from the
system:nodes group, i.e. Kubelets, which must be able to contact
the API server in order for workloads to be able to schedule on
them.
-
The leader-election priority level is for leader election requests from
built-in controllers (in particular, requests for endpoints, configmaps,
or leases coming from the system:kube-controller-manager or
system:kube-scheduler users and service accounts in the kube-system
namespace). These are important to isolate from other traffic because failures
in leader election cause their controllers to fail and restart, which in turn
causes more expensive traffic as the new controllers sync their informers.
-
The workload-high priority level is for other requests from built-in
controllers.
-
The workload-low priority level is for requests from any other service
account, which will typically include all requests from controllers running in
Pods.
-
The global-default priority level handles all other traffic, e.g.
interactive kubectl commands run by nonprivileged users.
The suggested FlowSchemas serve to steer requests into the above
priority levels, and are not enumerated here.
Maintenance of the Mandatory and Suggested Configuration Objects
Each kube-apiserver independently maintains the mandatory and
suggested configuration objects, using initial and periodic behavior.
Thus, in a situation with a mixture of servers of different versions
there may be thrashing as long as different servers have different
opinions of the proper content of these objects.
Each kube-apiserver makes an initial maintenance pass over the
mandatory and suggested configuration objects, and after that does
periodic maintenance (once per minute) of those objects.
For the mandatory configuration objects, maintenance consists of
ensuring that the object exists and, if it does, has the proper spec.
The server refuses to allow a creation or update with a spec that is
inconsistent with the server's guardrail behavior.
Maintenance of suggested configuration objects is designed to allow
their specs to be overridden. Deletion, on the other hand, is not
respected: maintenance will restore the object. If you do not want a
suggested configuration object then you need to keep it around but set
its spec to have minimal consequences. Maintenance of suggested
objects is also designed to support automatic migration when a new
version of the kube-apiserver is rolled out, albeit potentially with
thrashing while there is a mixed population of servers.
Maintenance of a suggested configuration object consists of creating
it --- with the server's suggested spec --- if the object does not
exist. OTOH, if the object already exists, maintenance behavior
depends on whether the kube-apiservers or the users control the
object. In the former case, the server ensures that the object's spec
is what the server suggests; in the latter case, the spec is left
alone.
The question of who controls the object is answered by first looking
for an annotation with key apf.kubernetes.io/autoupdate-spec. If
there is such an annotation and its value is true then the
kube-apiservers control the object. If there is such an annotation
and its value is false then the users control the object. If
neither of those condtions holds then the metadata.generation of the
object is consulted. If that is 1 then the kube-apiservers control
the object. Otherwise the users control the object. These rules were
introduced in release 1.22 and their consideration of
metadata.generation is for the sake of migration from the simpler
earlier behavior. Users who wish to control a suggested configuration
object should set its apf.kubernetes.io/autoupdate-spec annotation
to false.
Maintenance of a mandatory or suggested configuration object also
includes ensuring that it has an apf.kubernetes.io/autoupdate-spec
annotation that accurately reflects whether the kube-apiservers
control the object.
Maintenance also includes deleting objects that are neither mandatory
nor suggested but are annotated
apf.kubernetes.io/autoupdate-spec=true.
Health check concurrency exemption
The suggested configuration gives no special treatment to the health
check requests on kube-apiservers from their local kubelets --- which
tend to use the secured port but supply no credentials. With the
suggested config, these requests get assigned to the global-default
FlowSchema and the corresponding global-default priority level,
where other traffic can crowd them out.
If you add the following additional FlowSchema, this exempts those
requests from rate limiting.
Caution: Making this change also allows any hostile party to then send
health-check requests that match this FlowSchema, at any volume they
like. If you have a web traffic filter or similar external security
mechanism to protect your cluster's API server from general internet
traffic, you can configure rules to block any health check requests
that originate from outside your cluster.
apiVersion: flowcontrol.apiserver.k8s.io/v1beta3
kind: FlowSchema
metadata:
  name: health-for-strangers
spec:
  matchingPrecedence: 1000
  priorityLevelConfiguration:
    name: exempt
  rules:
    - nonResourceRules:
      - nonResourceURLs:
          - "/healthz"
          - "/livez"
          - "/readyz"
        verbs:
          - "*"
      subjects:
        - kind: Group
          group:
            name: "system:unauthenticated"
Diagnostics
Every HTTP response from an API server with the priority and fairness feature
enabled has two extra headers: X-Kubernetes-PF-FlowSchema-UID and
X-Kubernetes-PF-PriorityLevel-UID, noting the flow schema that matched the request
and the priority level to which it was assigned, respectively. The API objects'
names are not included in these headers in case the requesting user does not
have permission to view them, so when debugging you can use a command like
kubectl get flowschemas -o custom-columns="uid:{metadata.uid},name:{metadata.name}"
kubectl get prioritylevelconfigurations -o custom-columns="uid:{metadata.uid},name:{metadata.name}"
to get a mapping of UIDs to names for both FlowSchemas and
PriorityLevelConfigurations.
Observability
Metrics
Note: In versions of Kubernetes before v1.20, the labels flow_schema and
priority_level were inconsistently named flowSchema and priorityLevel,
respectively. If you're running Kubernetes versions v1.19 and earlier, you
should refer to the documentation for your version.
When you enable the API Priority and Fairness feature, the kube-apiserver
exports additional metrics. Monitoring these can help you determine whether your
configuration is inappropriately throttling important traffic, or find
poorly-behaved workloads that may be harming system health.
-
apiserver_flowcontrol_rejected_requests_total is a counter vector
(cumulative since server start) of requests that were rejected,
broken down by the labels flow_schema (indicating the one that
matched the request), priority_level (indicating the one to which
the request was assigned), and reason. The reason label will be
have one of the following values:
queue-full, indicating that too many requests were already
queued,concurrency-limit, indicating that the
PriorityLevelConfiguration is configured to reject rather than
queue excess requests, ortime-out, indicating that the request was still in the queue
when its queuing time limit expired.cancelled, indicating that the request is not purge locked
and has been ejected from the queue.
-
apiserver_flowcontrol_dispatched_requests_total is a counter
vector (cumulative since server start) of requests that began
executing, broken down by the labels flow_schema (indicating the
one that matched the request) and priority_level (indicating the
one to which the request was assigned).
-
apiserver_current_inqueue_requests is a gauge vector of recent
high water marks of the number of queued requests, grouped by a
label named request_kind whose value is mutating or readOnly.
These high water marks describe the largest number seen in the one
second window most recently completed. These complement the older
apiserver_current_inflight_requests gauge vector that holds the
last window's high water mark of number of requests actively being
served.
-
apiserver_flowcontrol_read_vs_write_current_requests is a
histogram vector of observations, made at the end of every
nanosecond, of the number of requests broken down by the labels
phase (which takes on the values waiting and executing) and
request_kind (which takes on the values mutating and
readOnly). Each observed value is a ratio, between 0 and 1, of a
number of requests divided by the corresponding limit on the number
of requests (queue volume limit for waiting and concurrency limit
for executing).
-
apiserver_flowcontrol_current_inqueue_requests is a gauge vector
holding the instantaneous number of queued (not executing) requests,
broken down by the labels priority_level and flow_schema.
-
apiserver_flowcontrol_current_executing_requests is a gauge vector
holding the instantaneous number of executing (not waiting in a
queue) requests, broken down by the labels priority_level and
flow_schema.
-
apiserver_flowcontrol_request_concurrency_in_use is a gauge vector
holding the instantaneous number of occupied seats, broken down by
the labels priority_level and flow_schema.
-
apiserver_flowcontrol_priority_level_request_utilization is a
histogram vector of observations, made at the end of each
nanosecond, of the number of requests broken down by the labels
phase (which takes on the values waiting and executing) and
priority_level. Each observed value is a ratio, between 0 and 1,
of a number of requests divided by the corresponding limit on the
number of requests (queue volume limit for waiting and concurrency
limit for executing).
-
apiserver_flowcontrol_priority_level_seat_utilization is a
histogram vector of observations, made at the end of each
nanosecond, of the utilization of a priority level's concurrency
limit, broken down by priority_level. This utilization is the
fraction (number of seats occupied) / (concurrency limit). This
metric considers all stages of execution (both normal and the extra
delay at the end of a write to cover for the corresponding
notification work) of all requests except WATCHes; for those it
considers only the initial stage that delivers notifications of
pre-existing objects. Each histogram in the vector is also labeled
with phase: executing (there is no seat limit for the waiting
phase).
-
apiserver_flowcontrol_request_queue_length_after_enqueue is a
histogram vector of queue lengths for the queues, broken down by
the labels priority_level and flow_schema, as sampled by the
enqueued requests. Each request that gets queued contributes one
sample to its histogram, reporting the length of the queue immediately
after the request was added. Note that this produces different
statistics than an unbiased survey would.
Note: An outlier value in a histogram here means it is likely that a single flow
(i.e., requests by one user or for one namespace, depending on
configuration) is flooding the API server, and being throttled. By contrast,
if one priority level's histogram shows that all queues for that priority
level are longer than those for other priority levels, it may be appropriate
to increase that PriorityLevelConfiguration's concurrency shares.
-
apiserver_flowcontrol_request_concurrency_limit is the same as
apiserver_flowcontrol_nominal_limit_seats. Before the
introduction of concurrency borrowing between priority levels, this
was always equal to apiserver_flowcontrol_current_limit_seats
(which did not exist as a distinct metric).
-
apiserver_flowcontrol_nominal_limit_seats is a gauge vector
holding each priority level's nominal concurrency limit, computed
from the API server's total concurrency limit and the priority
level's configured nominal concurrency shares.
-
apiserver_flowcontrol_lower_limit_seats is a gauge vector holding
the lower bound on each priority level's dynamic concurrency limit.
-
apiserver_flowcontrol_upper_limit_seats is a gauge vector holding
the upper bound on each priority level's dynamic concurrency limit.
-
apiserver_flowcontrol_demand_seats is a histogram vector counting
observations, at the end of every nanosecond, of each priority
level's ratio of (seat demand) / (nominal concurrency limit). A
priority level's seat demand is the sum, over both queued requests
and those in the initial phase of execution, of the maximum of the
number of seats occupied in the request's initial and final
execution phases.
-
apiserver_flowcontrol_demand_seats_high_watermark is a gauge vector
holding, for each priority level, the maximum seat demand seen
during the last concurrency borrowing adjustment period.
-
apiserver_flowcontrol_demand_seats_average is a gauge vector
holding, for each priority level, the time-weighted average seat
demand seen during the last concurrency borrowing adjustment period.
-
apiserver_flowcontrol_demand_seats_stdev is a gauge vector
holding, for each priority level, the time-weighted population
standard deviation of seat demand seen during the last concurrency
borrowing adjustment period.
-
apiserver_flowcontrol_demand_seats_smoothed is a gauge vector
holding, for each priority level, the smoothed enveloped seat demand
determined at the last concurrency adjustment.
-
apiserver_flowcontrol_target_seats is a gauge vector holding, for
each priority level, the concurrency target going into the borrowing
allocation problem.
-
apiserver_flowcontrol_seat_fair_frac is a gauge holding the fair
allocation fraction determined in the last borrowing adjustment.
-
apiserver_flowcontrol_current_limit_seats is a gauge vector
holding, for each priority level, the dynamic concurrency limit
derived in the last adjustment.
-
apiserver_flowcontrol_request_wait_duration_seconds is a histogram
vector of how long requests spent queued, broken down by the labels
flow_schema (indicating which one matched the request),
priority_level (indicating the one to which the request was
assigned), and execute (indicating whether the request started
executing).
Note: Since each FlowSchema always assigns requests to a single
PriorityLevelConfiguration, you can add the histograms for all the
FlowSchemas for one priority level to get the effective histogram for
requests assigned to that priority level.
-
apiserver_flowcontrol_request_execution_seconds is a histogram
vector of how long requests took to actually execute, broken down by
the labels flow_schema (indicating which one matched the request)
and priority_level (indicating the one to which the request was
assigned).
-
apiserver_flowcontrol_watch_count_samples is a histogram vector of
the number of active WATCH requests relevant to a given write,
broken down by flow_schema and priority_level.
-
apiserver_flowcontrol_work_estimated_seats is a histogram vector
of the number of estimated seats (maximum of initial and final stage
of execution) associated with requests, broken down by flow_schema
and priority_level.
-
apiserver_flowcontrol_request_dispatch_no_accommodation_total is a
counter vec of the number of events that in principle could have led
to a request being dispatched but did not, due to lack of available
concurrency, broken down by flow_schema and priority_level. The
relevant sorts of events are arrival of a request and completion of
a request.
Debug endpoints
When you enable the API Priority and Fairness feature, the kube-apiserver
serves the following additional paths at its HTTP[S] ports.
-
/debug/api_priority_and_fairness/dump_priority_levels - a listing of
all the priority levels and the current state of each. You can fetch like this:
kubectl get --raw /debug/api_priority_and_fairness/dump_priority_levels
The output is similar to this:
PriorityLevelName, ActiveQueues, IsIdle, IsQuiescing, WaitingRequests, ExecutingRequests, DispatchedRequests, RejectedRequests, TimedoutRequests, CancelledRequests
catch-all,         0,            true,   false,       0,               0,                 1,                  0,                0,                0
exempt,            <none>,       <none>, <none>,      <none>,          <none>,            <none>,             <none>,           <none>,           <none>
global-default,    0,            true,   false,       0,               0,                 46,                 0,                0,                0
leader-election,   0,            true,   false,       0,               0,                 4,                  0,                0,                0
node-high,         0,            true,   false,       0,               0,                 34,                 0,                0,                0
system,            0,            true,   false,       0,               0,                 48,                 0,                0,                0
workload-high,     0,            true,   false,       0,               0,                 500,                0,                0,                0
workload-low,      0,            true,   false,       0,               0,                 0,                  0,                0,                0
-
/debug/api_priority_and_fairness/dump_queues - a listing of all the
queues and their current state. You can fetch like this:
kubectl get --raw /debug/api_priority_and_fairness/dump_queues
The output is similar to this:
PriorityLevelName, Index,  PendingRequests, ExecutingRequests, VirtualStart,
workload-high,     0,      0,               0,                 0.0000,
workload-high,     1,      0,               0,                 0.0000,
workload-high,     2,      0,               0,                 0.0000,
...
leader-election,   14,     0,               0,                 0.0000,
leader-election,   15,     0,               0,                 0.0000,
-
/debug/api_priority_and_fairness/dump_requests - a listing of all the requests
that are currently waiting in a queue. You can fetch like this:
kubectl get --raw /debug/api_priority_and_fairness/dump_requests
The output is similar to this:
PriorityLevelName, FlowSchemaName, QueueIndex, RequestIndexInQueue, FlowDistingsher,       ArriveTime,
exempt,            <none>,         <none>,     <none>,              <none>,                <none>,
system,            system-nodes,   12,         0,                   system:node:127.0.0.1, 2020-07-23T15:26:57.179170694Z,
In addition to the queued requests, the output includes one phantom line
for each priority level that is exempt from limitation.
You can get a more detailed listing with a command like this:
kubectl get --raw '/debug/api_priority_and_fairness/dump_requests?includeRequestDetails=1'
The output is similar to this:
PriorityLevelName, FlowSchemaName, QueueIndex, RequestIndexInQueue, FlowDistingsher,       ArriveTime,                     UserName,              Verb,   APIPath,                                                     Namespace, Name,   APIVersion, Resource, SubResource,
system,            system-nodes,   12,         0,                   system:node:127.0.0.1, 2020-07-23T15:31:03.583823404Z, system:node:127.0.0.1, create, /api/v1/namespaces/scaletest/configmaps,
system,            system-nodes,   12,         1,                   system:node:127.0.0.1, 2020-07-23T15:31:03.594555947Z, system:node:127.0.0.1, create, /api/v1/namespaces/scaletest/configmaps,
Debug logging
At -v=3 or more verbose the server outputs an httplog line for every
request, and it includes the following attributes.
apf_fs: the name of the flow schema to which the request was classified.apf_pl: the name of the priority level for that flow schema.apf_iseats: the number of seats determined for the initial
(normal) stage of execution of the request.apf_fseats: the number of seats determined for the final stage of
execution (accounting for the associated WATCH notifications) of the
request.apf_additionalLatency: the duration of the final stage of
execution of the request.
At higher levels of verbosity there will be log lines exposing details
of how APF handled the request, primarily for debug purposes.
APF adds the following two headers to each HTTP response message.
X-Kubernetes-PF-FlowSchema-UID holds the UID of the FlowSchema
object to which the corresponding request was classified.X-Kubernetes-PF-PriorityLevel-UID holds the UID of the
PriorityLevelConfiguration object associated with that FlowSchema.
What's next
For background information on design details for API priority and fairness, see
the enhancement proposal.
You can make suggestions and feature requests via SIG API Machinery
or the feature's slack channel.
10 - Installing Addons
Note:
This section links to third party projects that provide functionality required by Kubernetes. The Kubernetes project authors aren't responsible for these projects, which are listed alphabetically. To add a project to this list, read the
content guide before submitting a change.
More information.
Add-ons extend the functionality of Kubernetes.
This page lists some of the available add-ons and links to their respective
installation instructions. The list does not try to be exhaustive.
Networking and Network Policy
- ACI provides integrated
container networking and network security with Cisco ACI.
- Antrea operates at Layer 3/4 to provide networking and
security services for Kubernetes, leveraging Open vSwitch as the networking
data plane. Antrea is a CNCF project at the Sandbox level.
- Calico is a networking and network
policy provider. Calico supports a flexible set of networking options so you
can choose the most efficient option for your situation, including non-overlay
and overlay networks, with or without BGP. Calico uses the same engine to
enforce network policy for hosts, pods, and (if using Istio & Envoy)
applications at the service mesh layer.
- Canal
unites Flannel and Calico, providing networking and network policy.
- Cilium is a networking, observability,
and security solution with an eBPF-based data plane. Cilium provides a
simple flat Layer 3 network with the ability to span multiple clusters
in either a native routing or overlay/encapsulation mode, and can enforce
network policies on L3-L7 using an identity-based security model that is
decoupled from network addressing. Cilium can act as a replacement for
kube-proxy; it also offers additional, opt-in observability and security features.
Cilium is a CNCF project at the Incubation level.
- CNI-Genie enables Kubernetes to seamlessly
connect to a choice of CNI plugins, such as Calico, Canal, Flannel, or Weave.
CNI-Genie is a CNCF project at the Sandbox level.
- Contiv provides configurable networking (native L3 using BGP,
overlay using vxlan, classic L2, and Cisco-SDN/ACI) for various use cases and a rich
policy framework. Contiv project is fully open sourced.
The installer provides both kubeadm and
non-kubeadm based installation options.
- Contrail,
based on Tungsten Fabric, is an open source, multi-cloud
network virtualization and policy management platform. Contrail and Tungsten
Fabric are integrated with orchestration systems such as Kubernetes, OpenShift,
OpenStack and Mesos, and provide isolation modes for virtual machines, containers/pods
and bare metal workloads.
- Flannel is
an overlay network provider that can be used with Kubernetes.
- Knitter is a plugin to support multiple network
interfaces in a Kubernetes pod.
- Multus is a Multi plugin for
multiple network support in Kubernetes to support all CNI plugins
(e.g. Calico, Cilium, Contiv, Flannel), in addition to SRIOV, DPDK, OVS-DPDK and
VPP based workloads in Kubernetes.
- OVN-Kubernetes is a networking
provider for Kubernetes based on OVN (Open Virtual Network),
a virtual networking implementation that came out of the Open vSwitch (OVS) project.
OVN-Kubernetes provides an overlay based networking implementation for Kubernetes,
including an OVS based implementation of load balancing and network policy.
- Nodus is an OVN based CNI
controller plugin to provide cloud native based Service function chaining(SFC).
- NSX-T Container Plug-in (NCP)
provides integration between VMware NSX-T and container orchestrators such as
Kubernetes, as well as integration between NSX-T and container-based CaaS/PaaS
platforms such as Pivotal Container Service (PKS) and OpenShift.
- Nuage
is an SDN platform that provides policy-based networking between Kubernetes
Pods and non-Kubernetes environments with visibility and security monitoring.
- Romana is a Layer 3 networking solution for pod
networks that also supports the NetworkPolicy API.
- Weave Net
provides networking and network policy, will carry on working on both sides
of a network partition, and does not require an external database.
Service Discovery
- CoreDNS is a flexible, extensible DNS server which can
be installed
as the in-cluster DNS for pods.
Visualization & Control
- Dashboard
is a dashboard web interface for Kubernetes.
- Weave Scope
is a tool for graphically visualizing your containers, pods, services etc.
Use it in conjunction with a Weave Cloud account
or host the UI yourself.
Infrastructure
Legacy Add-ons
There are several other add-ons documented in the deprecated
cluster/addons directory.
Well-maintained ones should be linked to here. PRs welcome!
